 Office Work
Excel Dashboards In An Hour – Intermediate
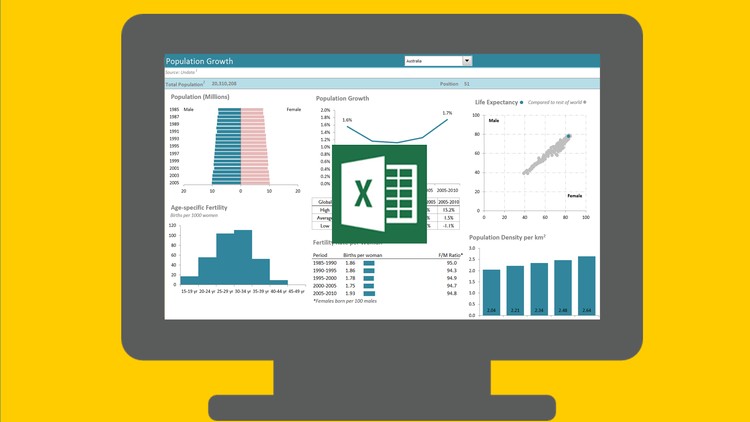
Impressive Content that Will Provide Insight, Analysis, and Alerts Dashboards are fully interactive and dynamic and can help with project management, customer service, retail management, financial forecasting and much more.
Excel Dashboard students should have access to the PC version of Excel 2010 or later. Students should also be familiar with putting together any type of report in Excel to be able to apply the time saving and visualization techniques taught here. Students should be able to build and apply basic formulas in Excel. Pivot Table and Chart knowledge are helpful, but expertise is not necessary to take this course.
Contents and Overview This course includes 9 lectures and just over 1 hour of content to give students a working knowledge of utilizing Excel to create interactive Excel Dashboards to communicate their data.
Included are the Excel Dashboard workbook and PowerPoint presentation from the course which contain notes on where you can find more resources. You can use the workbook to practice what you learn and as a quick reference guide later on.
The course covers advanced features of Excel Dashboards, such as display and visualization principles for clear dashboard creation, using interactive controls to keep the report informative and relevant. Analyzing and automating information for a fully functional and complete dashboard.
Upon completion, students will have a variety of techniques and examples that can be applied to their own datasets, among a host of other tips that can be used in day to day Excel work – Udemy.com